Menu
K. Iino, K. Toriumi, M. Miyashita, K. Suzuki, K. Tabata, S. Miyata, M. Takahashi, J. Fujii, M. Itokawa, M. Arai, Pentosidine accumulation induced by Akr1a deficiency drives aggression and hyperactivity, Neurosci. Lett. 877 (2026) 138557.
doi.org/10.1016/j.neulet.2026.138557
Advanced glycation end-products (AGEs) are compounds generated through non-enzymatic reactions between reducing sugars and the amino groups of biomolecules under conditions such as impaired glucose metabolism [1, 2]. AGEs form glycation modifications on proteins, nucleic acids, and lipids, thereby altering their structure and function. Given their involvement in the pathogenesis of age-related and chronic diseases — including diabetes, renal dysfunction, and neurodegenerative disorders [1, 3, 4] — inhibition of AGE formation has attracted considerable attention as a preventive and therapeutic strategy.
Pentosidine (PEN), a well-characterized AGE, accumulates with aging and has been reported to be elevated in a subset of patients with schizophrenia who lack comorbid renal dysfunction or diabetes. Since elevated PEN levels are associated with increased hospitalization frequency and higher antipsychotic drug dosages [5-7], PEN has been implicated in the pathophysiology of schizophrenia. However, experimental models that reliably reproduce PEN accumulation have been lacking, and the underlying mechanisms have remained unclear.
We have previously reported that glucuronic acid (GlcA), a precursor of PEN, is elevated in schizophrenia patients with high PEN levels [8], and that loss-of-function variants in AKR1A1 — the enzyme responsible for GlcA catabolism — are enriched in patients with schizophrenia, with AKR1A1 enzymatic activity negatively correlating with plasma GlcA levels [8, 9]. Together, these findings suggest that impaired AKR1A1 function contributes to the accumulation of both GlcA and PEN. In the present study, we employed Akr1a knockout (KO) mice to investigate how PEN accumulation resulting from AKR1A1 deficiency affects the pathophysiology relevant to schizophrenia.
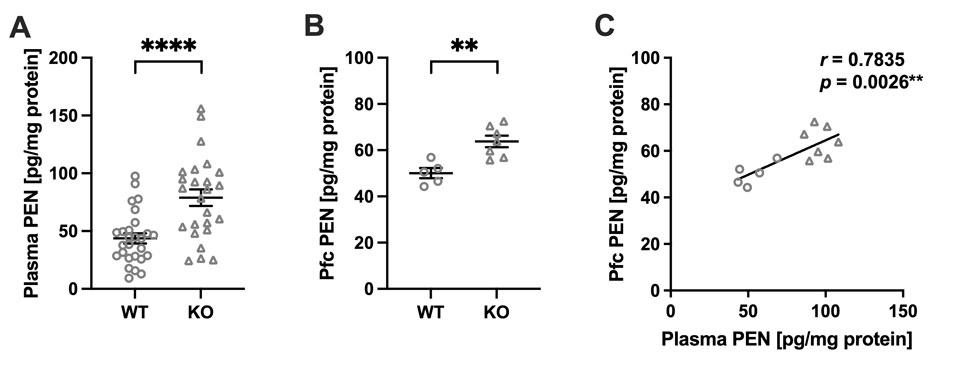
(A) Plasma PEN levels in WT (n =27) and Akr1a KO (n =25) mice. (B) PEN levels in the Pfc of WT (n =5) and Akr1a KO (n = 7) mice. **p <0.01, ****p <0.0001 by Student’s t-test. Data are presented as mean ±SEM. (C) Correlation between plasma and Pfc PEN levels across individuals. Circle plots represent WT, and triangle plots represent KO. **p < 0.01 by Pearson’s correlation coefficient.
Next, the behavioral impact of PEN accumulation was assessed using a battery of behavioral tests (Fig. 2A). In the Resident-Intruder (RI) test, KO mice exhibited a significantly shorter latency to first attack and a significantly longer total attack duration compared to WT mice (Fig. 2C, D). Furthermore, latency to first attack negatively correlated with plasma PEN levels, while total attack duration showed a positive correlation, suggesting an association between PEN accumulation and enhanced aggression (Fig. 2E, F). Spontaneous locomotor activity was recorded over 120 minutes and analyzed in two intervals: the first 30 minutes, reflecting exploratory behavior in a novel environment, and the last 30 minutes, reflecting baseline locomotion (Fig. 2G). KO mice showed a trend toward increased activity during the first 30 minutes (p = 0.0575) and a significant increase during the last 30 minutes (Fig. 2H, I). Plasma PEN levels correlated significantly with locomotor activity only during the first 30 minutes (Fig. 2J, K), suggesting that PEN accumulation is associated with novelty-induced exploratory behavior rather than sustained baseline locomotion.
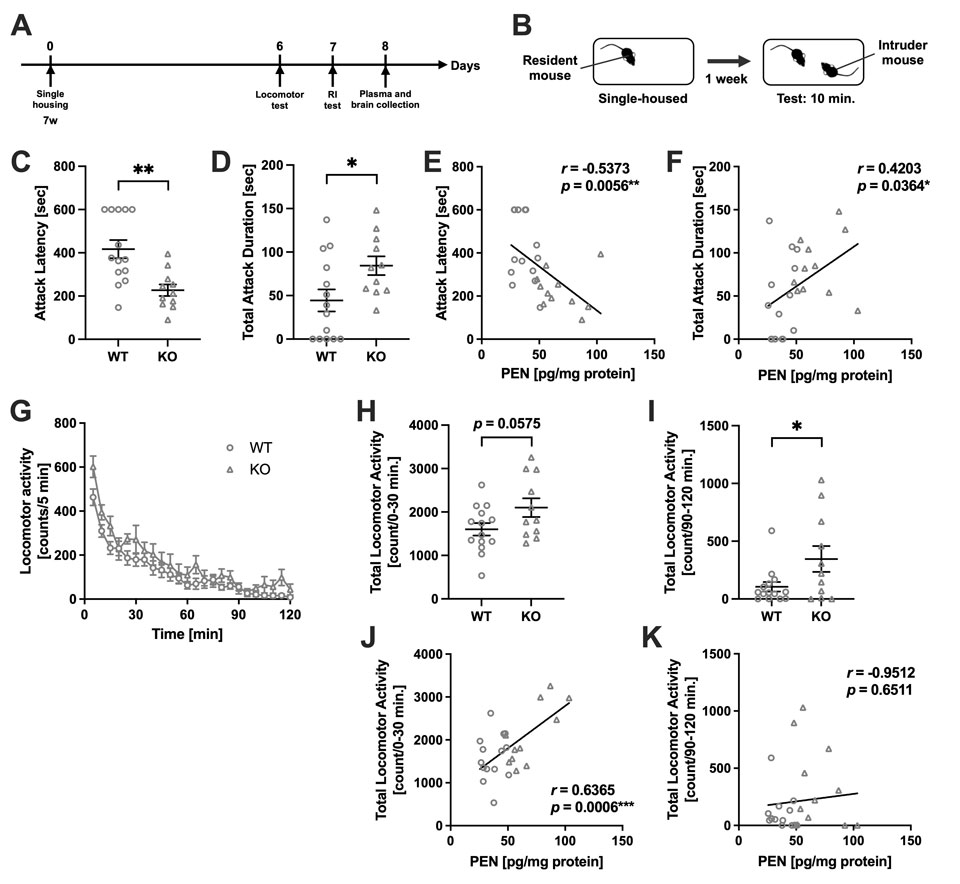
(A) The experimental timeline. (B) Schematic of the RI test. (C) Attack latency and (D) total attack duration in WT (n =14) and Akr1a KO (n =11) mice, using WT intruder mice. *p <0.05, **p <0.01 by Student’s t-test. (E) Correlation between plasma PEN levels and attack latency. (F) Correlation between plasma PEN levels and total attack duration. *p <0.05, **p <0.01 by Pearson’s correlation coefficient. (G) Locomotor activity was measured in 5 min intervals over 120 min. Total locomotor activity during (H) the first 30 min test session and (I) the late 90–120 min test session in WT (n =14) and KO (n =11) mice. *p <0.05 by Student’s t-test. Correlation between plasma PEN levels and total locomotor activity during (J) the first 30 min and (K) the late 90–120 min. ***p < 0.001 by Pearson’s correlation coefficient. Data are presented as mean ±SEM.
Finally, the effect of PEN accumulation on gene expression in the PFC was examined by RNA-seq analysis. A total of 51 differentially expressed genes (DEGs) were identified in KO mice (13 upregulated, 38 downregulated; fold change > 2.0, p < 0.05) (Fig. 3A, B). GO and KEGG pathway analysis using g:Profiler revealed alterations in pathways related to GlcA metabolism and AKR1A1-associated functions, as well as guanylate cyclase inhibitor activity, cytoskeletal organization, and immune response (Fig. 3C). Guanylate cyclase converts GTP to cGMP, a second messenger involved in the regulation of aggression and locomotor activity. Consistent with the transcriptional changes, cGMP levels in the PFC were significantly reduced in Akr1a KO mice (Fig. 3D), suggesting that impaired cGMP signaling contributes to the enhanced aggression and hyperactivity observed in these mice.
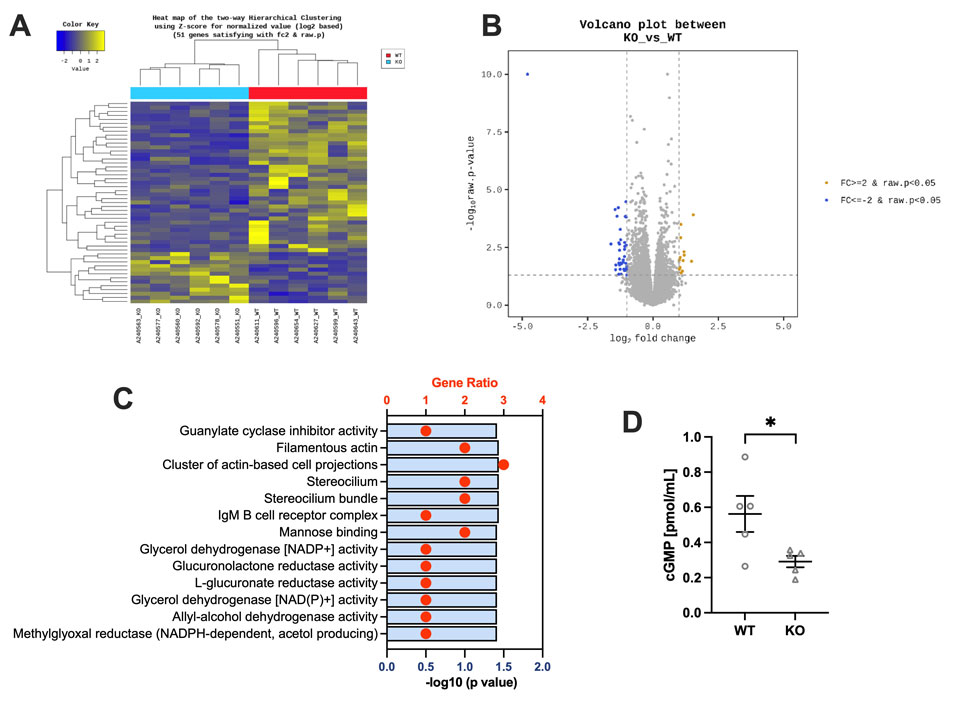
(A) Heatmap of DEGs between WT and Akr1a KO mice (fold change >2.0, p <0.05). (B) Volcano plot representing upregulated (yellow dots) and downregulated (blue dots) DEGs in Akr1a KO mice compared with WT mice. (C) GO enrichment analysis of DEGs. The gene ratio and − log10 (adjusted p-value) are shown. Only GO terms with an adjusted p-value <0.05 are displayed. (D) Quantification of cGMP levels in the Pfc of WT (n =5) and KO (n =5) mice. *p < 0.05 by Student’s t-test. Data are expressed as mean ±SEM.